- Print
- DarkLight
Identify SQL Performance Issues
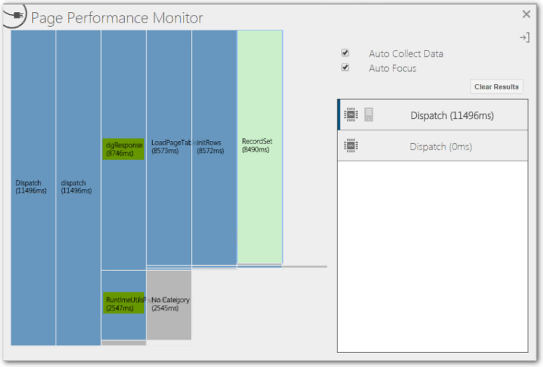
The Page Performance Monitor is a utility included with the Syniti Construct intended for technical users (those who are responsible for debugging SQL performance issues). Use it on custom pages to troubleshoot performance issues and to determine which portions of the page run slowly when the record set (or user set) increases dramatically.
Generally, there are two metrics that can help troubleshoot delays in load time: the 'dgResponse' and the 'RuntimeUtils.' The 'dgResponse' portion has a long and variable duration, while the 'RuntimeUtils' portion has an average and consistent duration.
The 'RuntimeUtils' portion consistently correlates with the number of columns displayed on the Horizontal View of a page. The more columns you have on the Horizontal View of a page, the longer the page will take to load.
The 'dgResponse' portion is a result of the performance of the page's underlying '%hor' view (Horizontal View). When there are too many columns in the %hor view of an underlying table, or complex logic embedded within the view (aggregations, etc), it prolongs the times it takes to complete queries, which affects the page's performance.
To access this utility, click Ctrl + Shift + K.


